
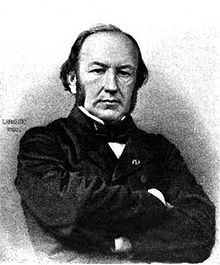
French physiologist Claude Bernard (1813-1878)
The famous French physiologist Claude Bernard once remarked: “The science of life is a superb and dazzlingly lighted hall which may be reached only by passing through a long and ghastly kitchen.” Bernard was right and science and technology are full of examples of scientists and inventors paying a heavy price for their discoveries.
Daniel Alcides Carrion, a Peruvian medical student, infected himself with pus from a purple lesion from a sick patient in 1885, seeking to demonstrate the link between a nodule on this patient and a disease known as Oroya Fever. He was successful in demonstrating the link… but unfortunately caught the disease himself and died. (He was made a national hero by the Peruvian government in 1991).
A few years later, in 1892, Bavarian chemist Max von Pettenkofer drank cholera bacteria in 1892, apparently to no effect.
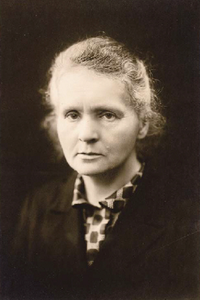
Marie Skłodowska-Curie (1867-1934)
Marie Curie, of course, stands alone in her decision to spend a life working with radioactive substances and paid the ultimate price, dying of radiation-induced aplastic anemia. Not Curie, nor anyone else at the time, knew of the damaging physiological effects of ionizing radiation. Reflecting how little was known, for years she had carried around test tubes containing radioactive compounds in her pocket.
More recently, in 1987, Dr. Daniel Zagury, a professor of immunology at the Pierre and Marie Curie University in Paris, injected himself with an experimental HIV vaccine.
The first experiment in Magnetic Resonance Imaging (MRI)—one of seven topics to be explored in a new software exhibit at CHM to open in 2014—is undoubtedly part of this same tradition of self-experimentation in the search for knowledge. In September of this year, a team from CHM, made up of curator Marc Weber and media producer Jon Plutte, travelled across Europe obtaining interviews for the new exhibit, to be called “Make Software: Change the World.”
For MRI, the radical medical technology that allows doctors to see inside the human body, we went to visit Sir Peter Mansfield at Nottingham University. Mansfield is discoverer of the ‘echo-planar’ technique of fast imaging and shared the 2003 Nobel Prize for Physiology or Medicine with American scientist Paul Lauterbur for their invention of MRI. Mansfield’s contribution was to show how radio signals from an MRI could be mathematically analyzed and used to form an image.
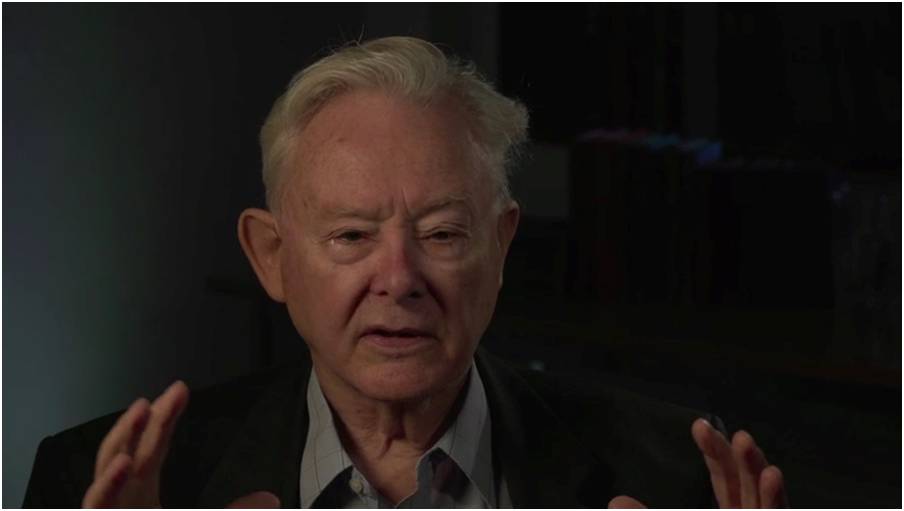
Sir Peter Mansfield, CHM Interview, University of Nottingham, September 17, 2012.
Mansfield describes the first human live experiment in 1975 with his new machine, in which he himself was the test subject for an abdominal scan:
Mansfield’s discovery was a major proof-of-concept in the development of the technology. The computer he used was a modestly powerful minicomputer, used to control the scanning and processing of Mansfield’s rudimentary images.
Control of the scanning itself is the most delicate yet powerful contribution of computing to MRI. MRI works by basically ‘pinging’ hydrogen atoms (protons) in the body with an electromagnetic pulse and then listening for the response. The shape, phase and frequency of these pulses are controlled entirely by software and it is through this software control that different tissue types in the body can be revealed. One pulse sequence may highlight fat, another water, and still another, cartilage.
Using a specialized pulse sequence, under software control, MRI is especially good at revealing soft tissues like this spinal cord, cartilage, and vertebrae
MRI, of course, also has formidable hardware: a giant superconducting magnet, cooled by liquid Helium to -453 degrees Fahrenheit, and various types of ‘coils’ to direct and shape the scanning signals and to listen for the response from the body. The signals involved are both enormous and tiny, as shown in the diagram below.
Making sense of the tiny signals is the job, again, of software, which filters out the signal from the surrounding noise, resulting in a useful image. But the resulting images are more than just ‘snapshots’ of the body’s interior. By taking multiple images (as slices) of the human body, the MRI allows doctors to ‘page through’ an image—gliding through a brain or a knee joint with a touch of a mouse and revealing the relationships between surrounding structures and the particular area of interest. This ability to visualize soft structures has revolutionized medicine by largely eliminating exploratory surgery as a means of looking inside the body.
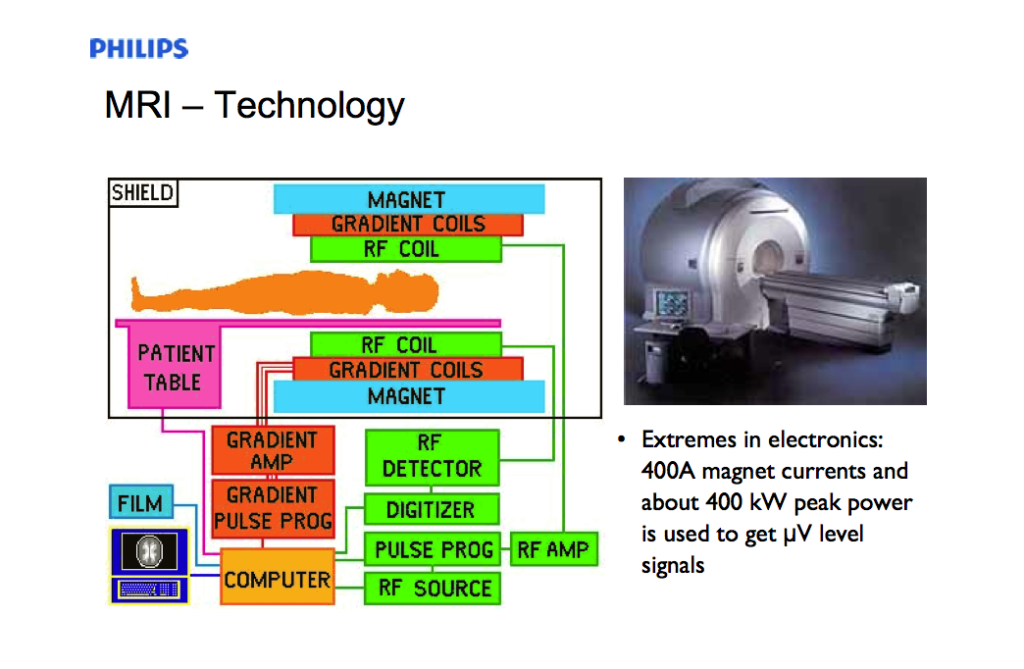
A diagram from Philips on all the components to an MRI machine.
Mansfield placed great emphasis on the software behind MRI and the essential role of computers in making it possible:
Today, software plays an even more central role, with MRI manufacturers developing dozens of specialized algorithms to undertake sophisticated imaging studies—like tracing the movement of a beating heart, for example.
As well explaining how software has allowed the MRI machine to be created, the MRI gallery of the Make Software: Change the World exhibit will feature and interactive video table in which visitors can try their hand at paging through an MRI image, just like a radiologist.
Finally, if you’d like to try your hand at interpreting an MRI image before then, try the following quiz, provided courtesy of MRI exhibit consultant Professor Dwight Nishimura, Stanford University.
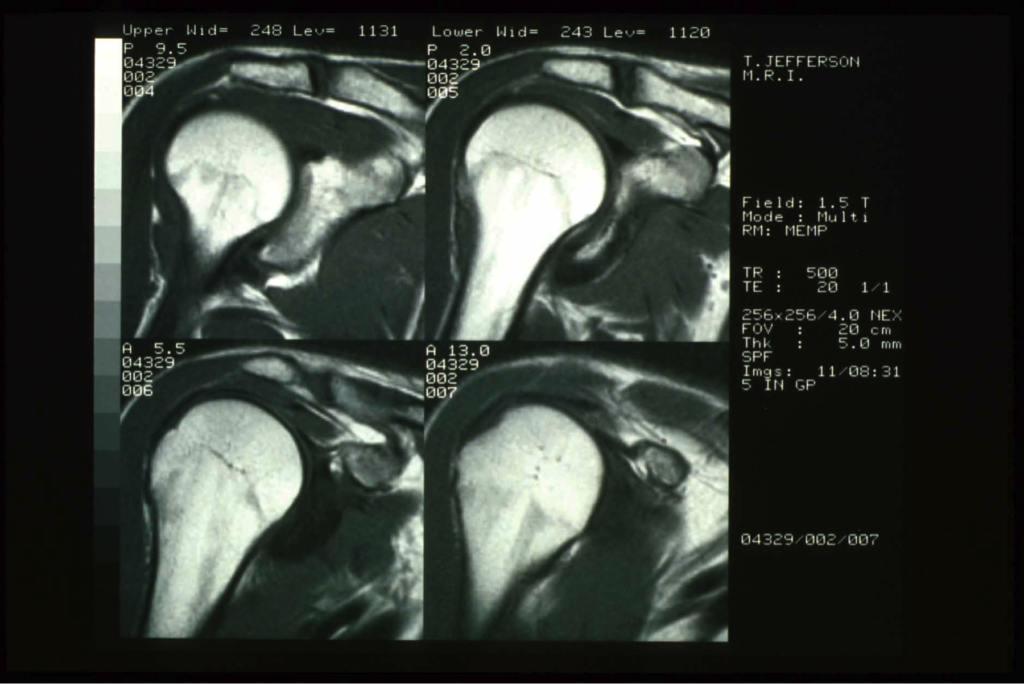
Image A
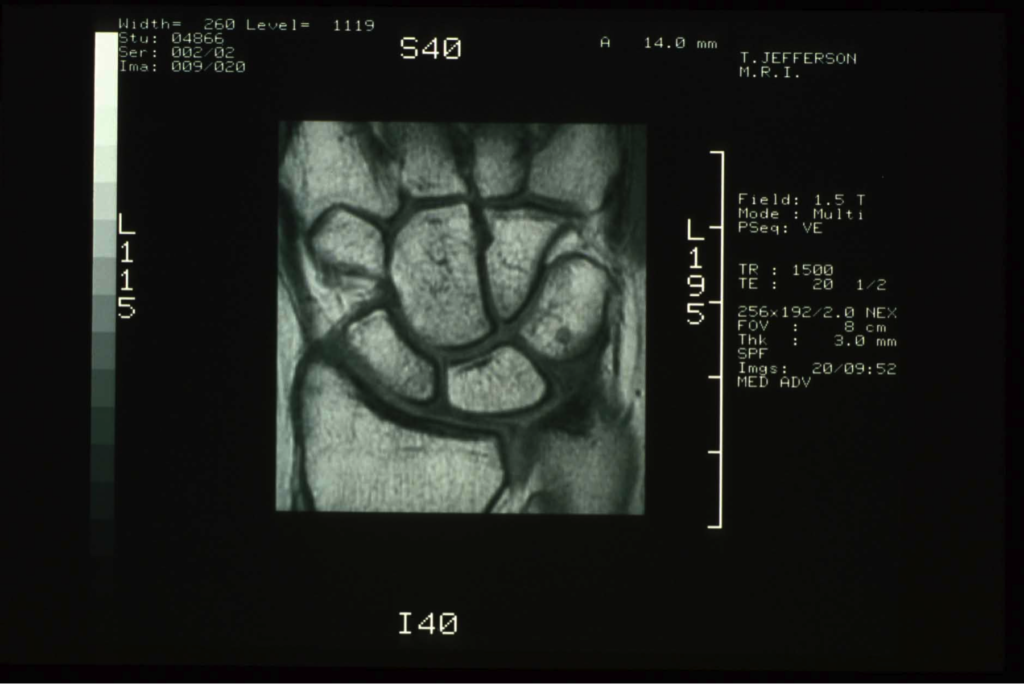
Image B
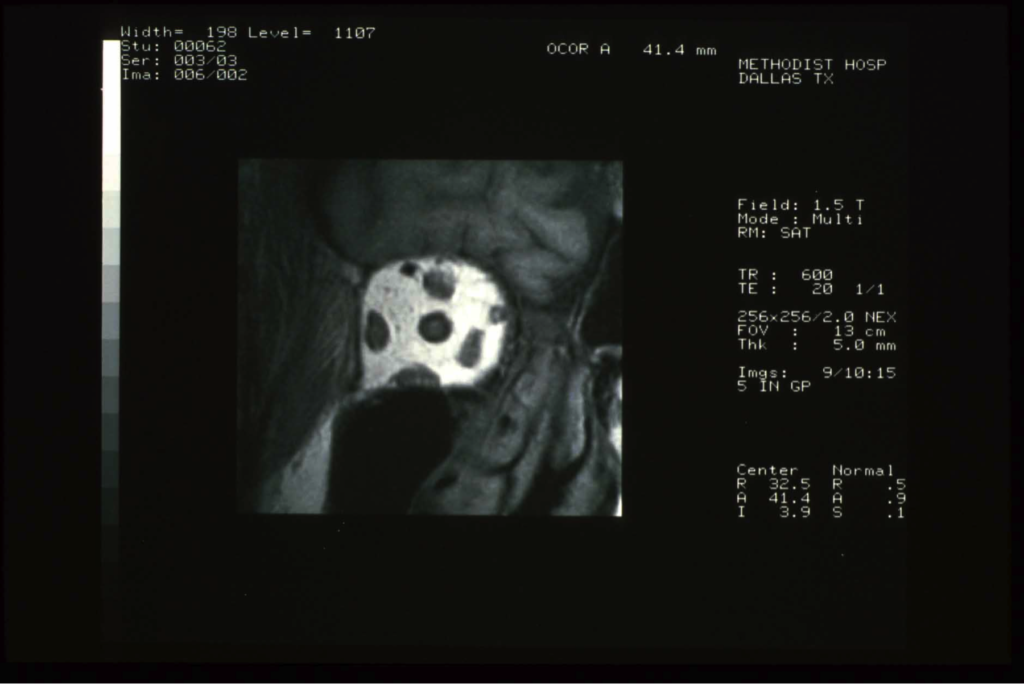
Image C
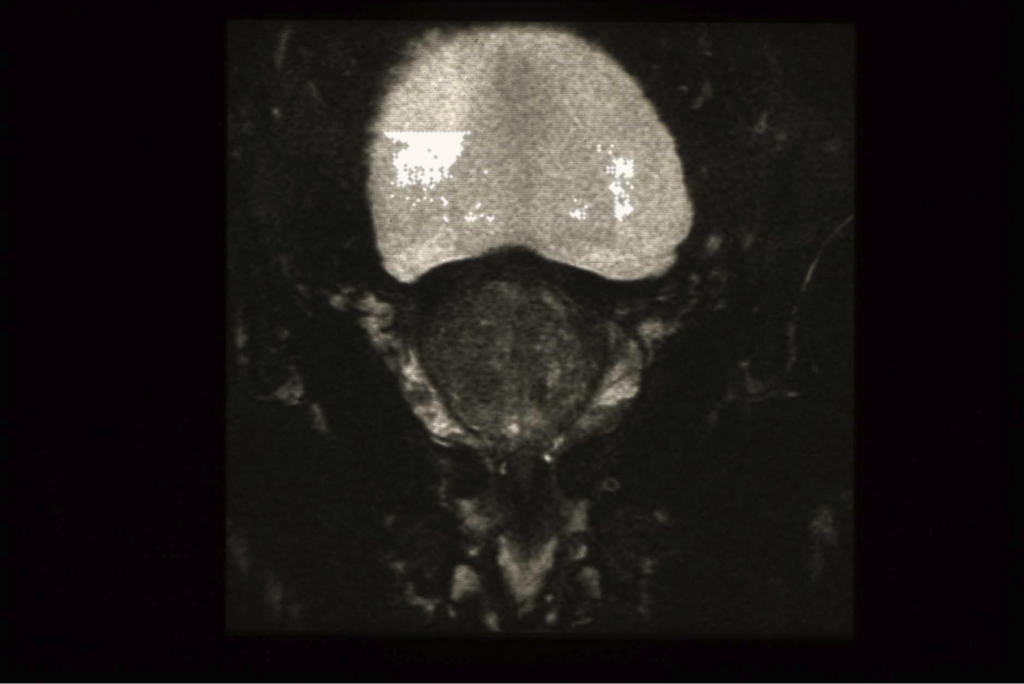
Image D
Image A: shoulder
Image B: hand
Image C: optic nerve (behind the eye)
Image D: prostate and bladder (bladder is bright)